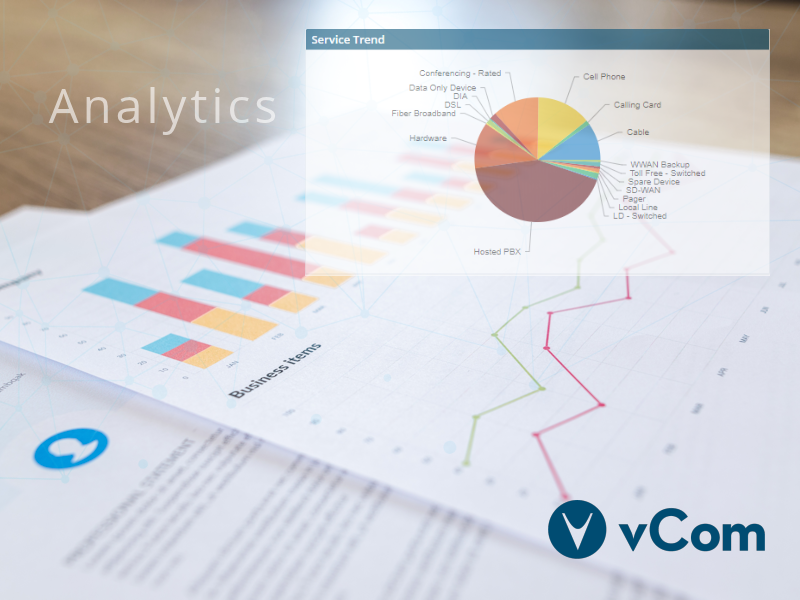
IT Lifecycle Management 9-Point Series: Blog #9 ANALYTICS/BI
Gaining Visibility and Optimization with Analytics and the Right Management tools
Attaining Analytics and Business Intelligence (BI) is a near-impossible task when it comes to managing IT spend – unless you’ve got the right management platform in place. A distributed enterprise must leverage multiple providers across multiple products and locations. You’re hard-pressed to find one carrier who will give you the right tools to analyze your spend, much less have the ability to tie all the data together across multiple vendors in a meaningful way. Most network operators offer hard-to-decipher and jargon-laden summary invoices with no month-to-month trending; some provide bare-bone e-bills that do a poor job of tying the charges back to the inventory. While a few offer portals with some reporting functionality, forget any attempt at tying charges back to cost centers, business units or employees, or any means of determining outliers – after all, they have no interest in pointing out areas of savings or runaway costs that might affect their bottom line. The responsibility is left to the already-stressed IT manager to decipher what she/he can with whatever limited time available, and leverage basic spreadsheets to try to make sense of it all.
Considering the lack of clarity, the task of understanding IT spend goes by the way side, and with it goes any hope of truly optimizing your IT environment. If in your quest to gain some efficiencies, you’ve decided to leverage a consolidator to streamline the sourcing and billing of IT services, you’ve won half the battle. Now instead of 100 invoices, you might get just a few – one from your consolidator, and a few from miscellaneous small providers here and there. The task of putting that data into your home-grown spreadsheet to make sense of it all remains the responsibility of the same otherwise-engaged IT manager. As to proactive reporting, forget it!
What most enterprise CIOs do not know is that there is a better way; what their colleagues in Fortune 500 organizations have relied on for several years is leveraging an IT Lifecycle Management (ITLM) platform. An ITLM platform acts as a central repository of IT expenses across multiple providers, products, and locations. With the plethora of technologies to manage, ITLM has become one of the required tools in the enterprise CIO’s arsenal in providing Business Intelligence and Analytics to help drive control and competitiveness in an otherwise uncertain economy.
Your ITLM platform needs to offer sophistication in providing a clear and concise spend management engine:
1. Report Library
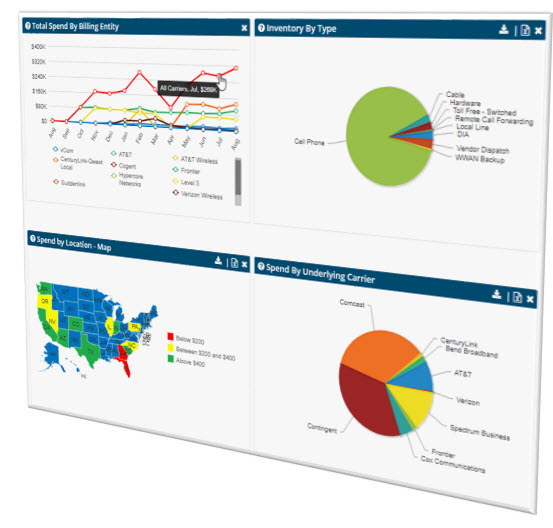
Many organizations struggle with the fact that the only system that has their “IT” spend is their A/P system, yet that system doesn’t offer up sufficient granularity to discern what’s what. As spend trends change, an effort to reduce costs in one technology might be overshadowed by planned growth in another area – leaving the CFO and CIO wondering whether or why costs never got reduced. Your platform must enable you to look at costs at a corporate level, but also allow up to break down the data to the office or region level, and down to the employee level. The spend management engine needs to provide reports that give you the ability to look at spending at a macro level, while also affording visibility at the product, location, cost center, and carrier level. The application needs to allow for drilling down to the lowest possible level – charges at the line, feature or call level. No matter how sophisticated a reporting engine may be, users still want the ability to manipulate the data with ad-hoc reporting. As a last resort, you should be able to export reports to common formats, such as Excel and CSV.
2. Trend Analysis
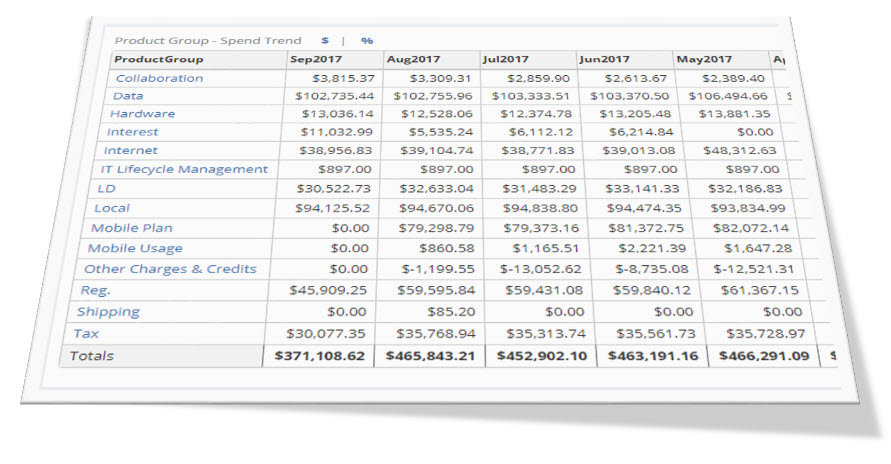
Having simple and clear monthly spend reports is important, but equally important is the ability to analyze trends and fluctuations in spending over time to easily determine causes of concern. The options to quickly determine percentage change or flag non-recurring charges that impact monthly invoices are necessary for gaining control over spend.
3. Metrics
Whatever system you use, it should enable users to establish thresholds for flagging outliers and fluctuations, and offer reports that automatically provide the user with savings opportunities while eliminating manual analysis and taking advantage of intelligent reporting.
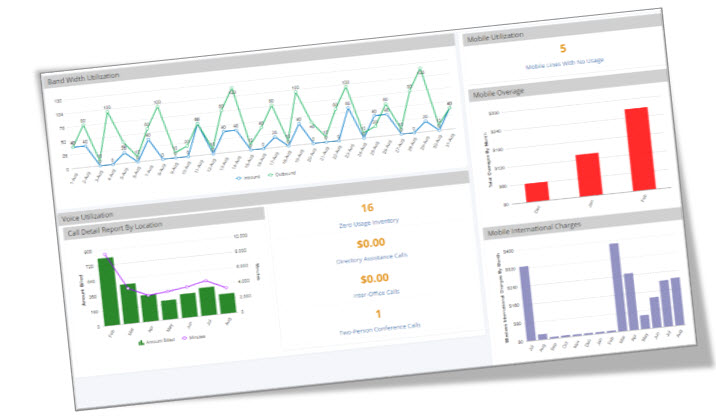
4. Utilization
Many organizations struggle with generating reports about IT, whether they’re spend-related or operationally-related, due to the disparate systems that the providers offer, and the lack of a centralized environment or tools to have a clear view. At best, they can generate macro spend reports but can’t drill down below the surface to truly understand their utilization. An efficient solution is one that centralizes all data and provides an enterprise with the ability to examine the data whichever way is needed by the user. Whether it’s an IT engineer looking at circuit utilization, or an accounting manager looking for inventory with no usage, or a regional manager looking for toll free utilization across her five regional offices, the solution must support flexibility – flexibility in providing information across target users and flexibility in working with a partner who will help you build reporting that benefits your organization.
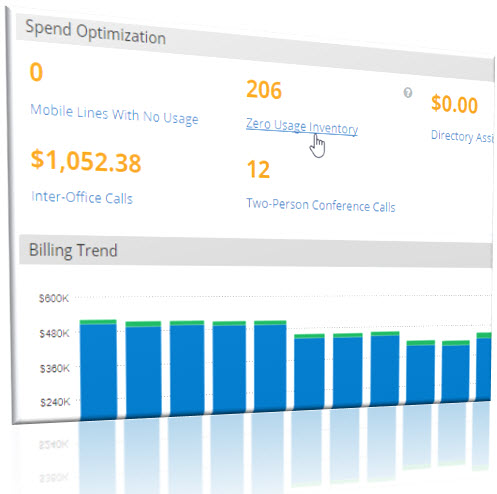
5. Actionable Info
Even with an ITLM application in hand, your IT manager still has to review the data and identify areas for optimizing spend. With an already full plate, chances are she/he is unable to dedicate time to scouring reports and reviewing graphs to effectively help the organization. A powerful application is one that provides true BI reporting in the form of actionable info that can generate immediate hard and/or soft savings. Reports must include annual trending of spend-data by product, by location and/or by cost center. The platform must also include excessive charge reports that point to areas of savings (zero-usage inventory, directory assistance calls, two-person conferencing calls, etc.). It must include reports that validate the effectiveness of infrastructure projects like VOIP upgrades to eliminate interoffice calls. Reports from a sophisticated ILTM platform must put the information at the IT manager’s fingertips, so she/he can act upon it quickly to help achieve true cost savings promptly. The reports must also provide CIOs with a global view when it comes time to preparing budgets and analyzing where the organization has been and where it’s going.
While ITLM platforms are new to the mid-enterprise, and they constitute a shift in the frame of reference in how to manage IT spend, they have proven to be invaluable tools for CIOs in Fortune 500 organizations. With the consumerization of IT, the growth of cloud services, and the shift from CAPEX to OPEX-based infrastructures, having such a platform to manage spend across wireline, mobile, collaboration and cloud services has become a necessity and not a luxury.
Post your comments or questions for Sameer below to dive further into Analytics/BI.
 Author: Sameer Hilal
Chief Operating Officer
Sameer Hilal is the Chief Operating Officer and co-founder of vCom Solutions. He effectively leads vCom to be a market leader in the implementation and support of advanced telecommunication solutions. In 2005, vCom was ranked as the # 1 Fastest Growing Private Company in the San Francisco Bay Area. In 2006, vCom was ranked as the #51 Fastest Growing Company in the United States (Entrepreneur). LinkedIn